PROMETHEUS SWISS KNIFE EXPORTER
Quick universal exporter. It is quick not because it works fast but because You can add monitoring metric in 2 minutes. But if needed, you can substitute any special exporter, with swiss_knife_exporter.
Why it might be usefull?
- You can add temporary metric. And it will not take more than 5 minutes.
- Cannot find special exporter for something you need to monitor.
- Use only one exporter for everything. In case you know what data you need.
Dependencies
- PYyaml
- prometheus_client
- zabbix_agent (Optional. if useZabbix=true)
#pip3 install prometheus_client pyyaml
How it works
For thouse who is not familiar with zabbix. Zabbix it is a server and an agent. The Server polls agents with some interval. The agent supports a default list of metrics(https://www.zabbix.com/documentation/3.0/manual/config/items/itemtypes/zabbix_agent), and can be extended with custom metrics (https://www.zabbix.com/documentation/3.0/manual/config/items/userparameters?s%5B%5D=userparameter). So we will use only the agent (no server).
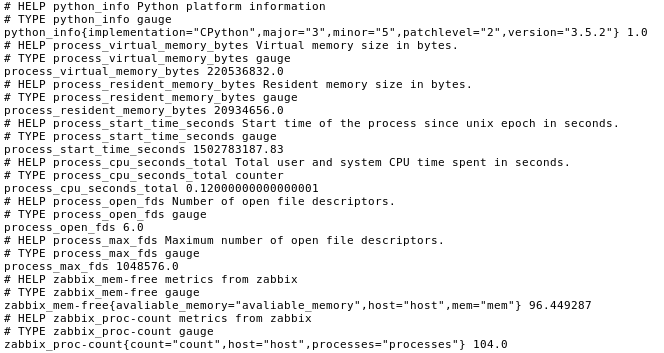
At this point we have a source of metrics, very powerful and flexible source. Prometheus server uses an HTTP connection to get metrics. So literally speaking prometheus is a HTTP client and an export is a HTTP server. swiss_knife_exporter is a server which gets metrics from zabbix_agent and supply them to prometheus server.
In some special cases it is possible to run swiss_knife_exporter solo - without zabbix_agent. To do this, useZabbix option should set to false and metric should contain either shell command (using pipe is also possible) or path to shell script.
exporter_config.yml contains information how to connect to zabbix_agent and information about metrics. Native config format for promethus is YAML. So exporter_config.yml uses yaml as well.
All fields are mandatory.
---
zabbix_config:
  host: ...
  port: ...
  socket_timeout: ...
exporter_config:
  exporter_port: ...
  syslog: False or True
  useZabbix: False or True
metrics:
  -
    name: ...
    metric: vm.memory.size[pavailable]
    ^ OR V
    metric: "cat /proc/cpuinfo | grep processor | wc -l"
    labels: []


By default swiss_knife_exporter looks for exporter_config.yml in:
- /etc/prometheus_swiss_knife_exporter/
- ~/.exporter_config.yml
- in folder with
swiss_knife_exporter.py
DEMO
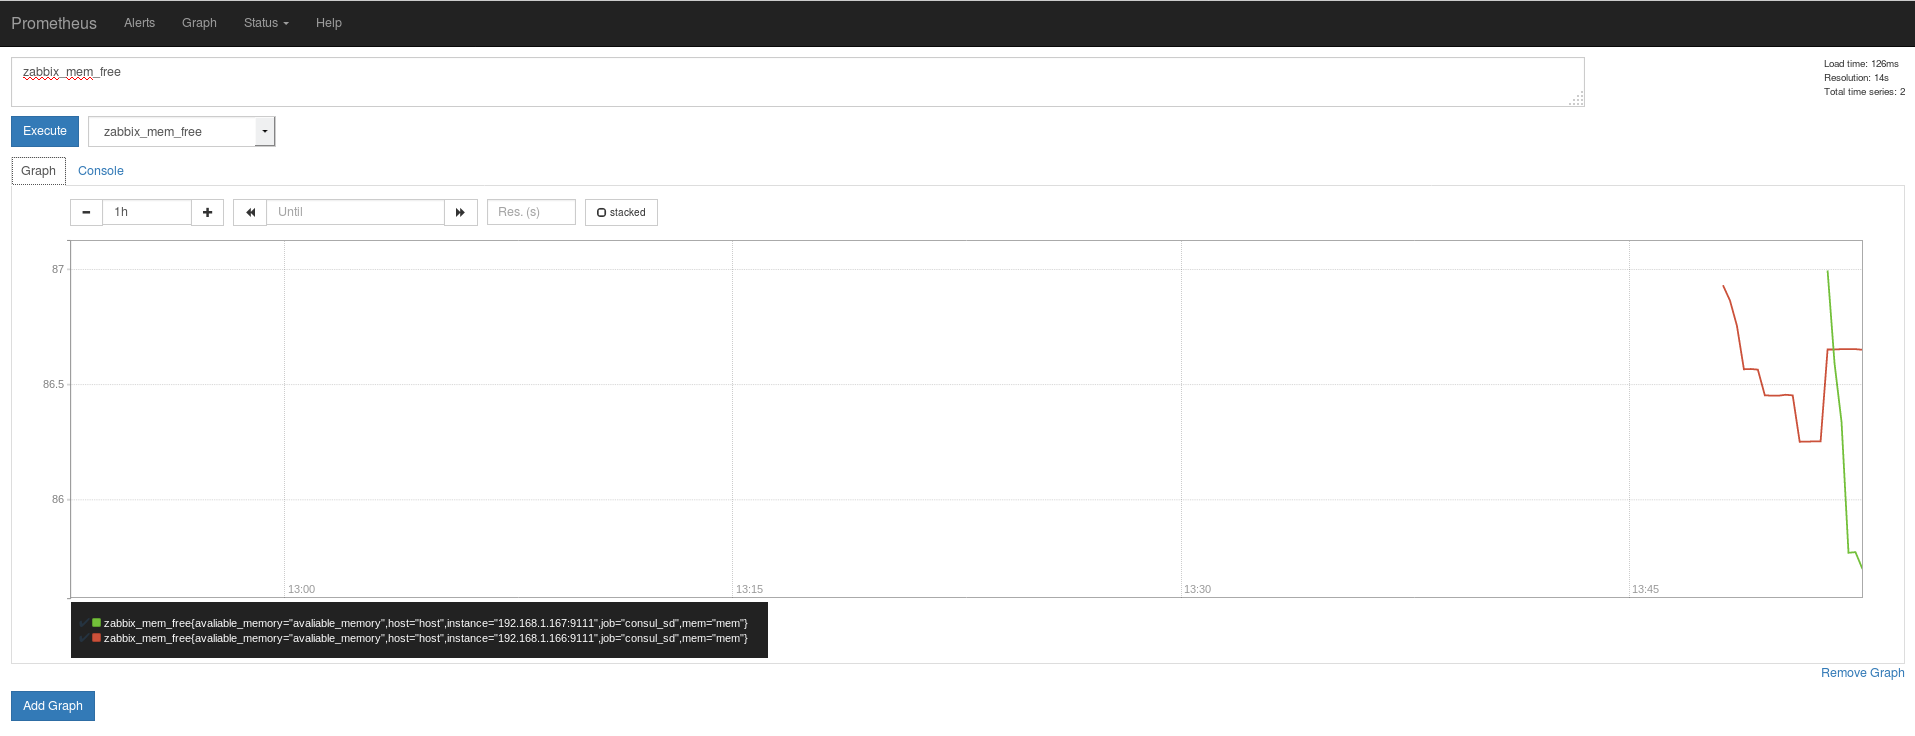
You can try it by vagrant up https://github.com/pymag09/local_env/tree/master/consul_prometheus